Next Generation Sequencing Analysis
The Bioinformatics support at BEA includes assist with the design and analysis of next generation sequencing experiments. BEA provides consultation services for experimental design, analysis strategy, statistical considerations, price enquire and general help to select the appropriate analysis method. Many of BEA members have long experience in genomic analysis and we have also implemented an infrastructure for data handling and different analys pipelines for the projects that we run at BEA. The data analysis part is specifically designed for each project and can be divided into different steps.
Please contact us for detailed information or to set up an appointment. Questions concerning bioinformatic services at BEA can be answered by David Brodin, Tassos Damdimopoulos or Fredrik Fagerstrom Billai.
Sequence metrics and SAV Quality Control
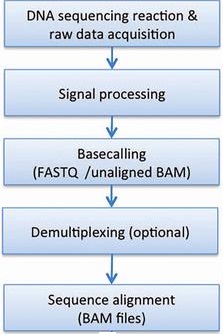
Bioinformatic processing at BEA starts after the generation of sequence RAW data generated from Illumina sequencing. After each run the sequence raw data is backed-up on our servers, controlled and checked with the illumina Sequence Analysis Viewer (SAV) software to investigate the general quality of the actual sequence run. QC metrics like the amount of reads (Mreads) , Total yield (Gb), cluster density (K/mm2), aligned PhIX (%) control, clusters passing chastity filter (%PF) and Q30 error rate (%) are important features of the actual run.
Basecalling and Demultiplexing of data
Illumina sequencing instruments generate BCL basecall files as primary sequencing output. Downstream analysis involves processing base calls and conversion to FASTQ files with the Illumina bcl2fastq software. At the same time as converting RAW data bcl2fastq also separates multiplexed pooled samples in the actual sequencing run. Multiplexed sequencing allows you to run multiple individual samples in one lane. The samples are identified by index sequences that are linked to the library template during sample preparation step. The multiplexed sample FASTQ files are assigned to projects and samples based on a user provided sample sheet together with a various report files with demultiplexing statistics and generated undetermined reads. If the sample sheet contain wrong information libraries will not be demultiplexed. This can happen if the investigator provides the wrong sequence or if the index sequence is not added in the correct orientation.
- bcl2fastq manual
- Demultiplexing sample sheet template can be downloaded here
Sequence alignment
To determine where on the genome of interest the accumulated sequence reads originates from we next align continuous reads to a genome of reference. For this process we commonly use software like Bowtie, TopHat and STAR which uses different algorithms suitable for different applications like RNA-seq, ChIp-seq, BS-seq, ss-Seq and others. STAR is an aligner designed to specifically address many of the challenges of RNA-seq data mapping using a strategy to account for spliced alignments. Before mapping can be performed adapter and other non-genomic content are trimmed away. In parallel with the mapping, the sequences from each sample can be investigated for general quality with a QC tool like Multi QC, which is a tool to aggregate results from bioinformatics analyses across many samples into a single report. Alignments are commonly represented both graphically and in text format like the SAM/BAM format (Sequence Alignment Map/Binary Alignment Map).
Differential expression testing and peakcalling.
Once the reads have been aligned the next step is to analyze the read count data and detect differentially expressed genes. The count data will be presented as a table reports for each sample, and the number of sequence fragments that have been assigned to each gene. As well as RNA-seq data it can be applied to differential signal analysis of other types of genomic data that produce gene counts like ChIP-seq, BS-seq and others. Differential expression analysis of aligned data profiles with biological replication is routinely managed with different tools like DESq2 and EdgeR. The analysis output consists of normalised counts, Log2 Fold Changes and P-values.Similarly, finding enriched peaks, regions, and transcripts can be of interest. The HOMER software performs peak calling and transcript identification analysis which could be central for ChIP-Seq and associated types of experiments.

- Customer Information:
- Project Submission
- External Users
- iLabs
- NGS Sample Submission
- How to acknowledge BEA
- Reference List
- Latest Newsletter
- FAQs
- BEA Price List:
- Order Forms:
- Links:
- KI core facilities for research
- SICOF-Single cell core facility
- CBB-Centre for Bioinformatics and Biostatistics
- SciLifeLab
- National Bioinformatics Institute Sweden
| BEA Service Fees |  |
| BEA Services | |  |